Navigating the Universe of AI-Generated Imagery with an Immersive 3D experience
João Fiadeiro • 2023-09-13
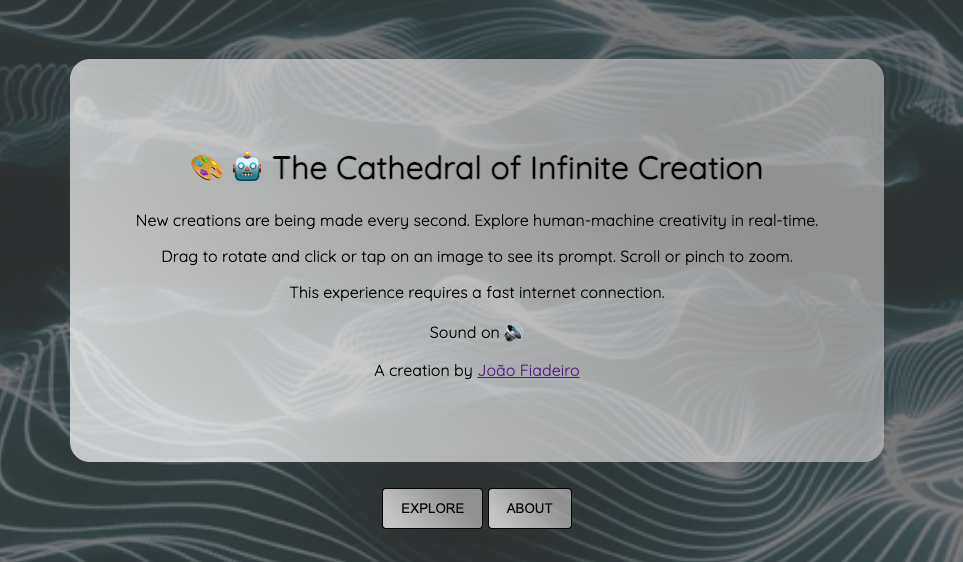
The "Cathedral of Infinite Creation" gathers a feed of real AI-generated content and allows you to visualize images in a 3D environment. I built this tool to help you discover all the wonderful images being generated on MidJourney. Click on an image to see the prompt behind it. Follow the edges to find images that are semantically related. Every few seconds, with the sound of a drop, another image is added from a never-ending feed....
Explore the Cathedral of Infinite Creation
or visit www.infinitecreation.art
Video demo below (YouTube)
A Confluence of Human and Machine Creativity
We live in an era where creativity knows no bounds. Every day, humans generate thousands of hours of content, pushing the very definition of imagination. Yet, the advancements in generative AI are setting the stage to make this creative output go exponential. Imagine, every single minute, there are countless new images being synthesized—some beautiful, some strange, some emotive, and yes, some dull. Yet most of these creations are lost in a messy Discord server. What if there was a way to not just observe this unfolding phenomenon but to immerse yourself into it?
Enter the "Cathedral of Infinite Creation," a tool designed to offer a 3D-visualized journey through the constantly evolving world of AI-generated content. It was built to evoke the never-ending stream of content - a small glimpse into the human psyche. By ingesting tens of thousands of creations from MidJourney we can create an experience that I feel conveys the richness of human-machine creativity.
When diving into any new project, having a tangible goal in mind is crucial. For me, the Cathedral project was a chance to meld two areas that have always fascinated me: generative AI and immersive media. It was the perfect sandbox to tinker around with THREE.js—a powerful library for 3D graphics—while also satisfying my own curiousity: what the heck are people using this powerful technology for?
In this comprehensive write-up, we'll explore the Cathedral's multiple facets:
- Data Gathering from Midjourney: How this tool taps into a real-time feed of AI-generated content.
- Semantic Similarity: Utilizing OpenAI's embedding model to draw meaningful connections between diverse pieces of content.
- The Magic of THREE.js: A layman’s walkthrough on how this 3D library and other components were used to create an immersive experience that is as educational as it is captivating.
So, without further ado, let's dive right into this.
Data Gathering from Midjourney
The Quest for a Public Repository of AI-Generated Images
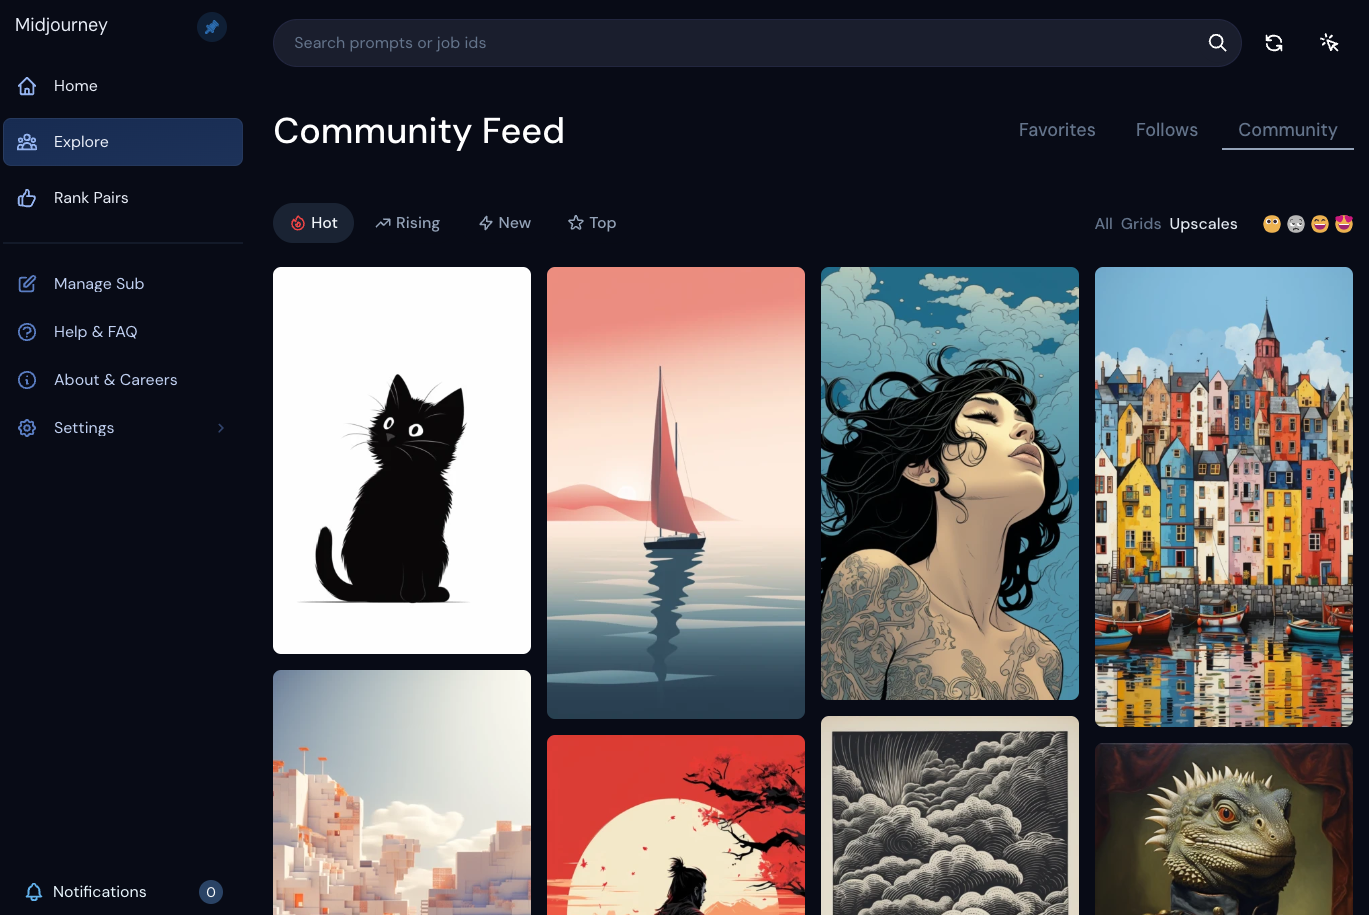
Finding a public repository of AI-generated images is like searching for a needle in a haystack. Many of the big players like OpenAI and Google don’t make their DALL-E generated images public. Enter MidJourney—a platform that's not as guarded with its synthesized imagery. Interestingly, it leverages Discord as its primary UI, making the generated images public by default.
If you’ve ever ventured into MidJourney's Discord server, you'll understand when I say it's both a boon and a curse. With dozens of active channels and images pouring in by the hundreds every second, the volume is staggering. Discord's interface, while functional, doesn’t do justice to the torrent of synthetic content being generated. In simpler terms, it’s a chaotic mess—but a fascinating one.
The Challenge: Scraping Discord
Scraping this colossal amount of data from Discord is anything but straightforward. Firstly, you'd need to construct a complex bot, which isn't a walk in the park. Secondly, the incoming data is so unstructured that the bot would likely crash constantly. Oh, and let’s not forget that scraping Discord would violate their Terms of Service—a route none of us would want to take.
Discovering a Non-Public API
While MidJourney doesn’t advertise a public API, necessity is the mother of invention. And let’s face it, if there’s a community feed, there has to be an API powering it. A bit of sleuthing led me to MidJourney's endpoint (https://www.midjourney.com/api/app/recent-jobs). Although they’ve implemented a strict CORS policy blocking external requests, one can still execute a few fetch commands from the browser's console. In essence, this mimics manual navigation through their feed. As far as I could tell, this does not violate and acceptable use policies so I decided to dig in.
Taking a look at the Network tab of my trusty Developer Tools section of Chrome, you can see that each response is rich with metadata for 35 images, containing invaluable data points like timestamp, user, and most tantalizingly—the prompt behind each image.
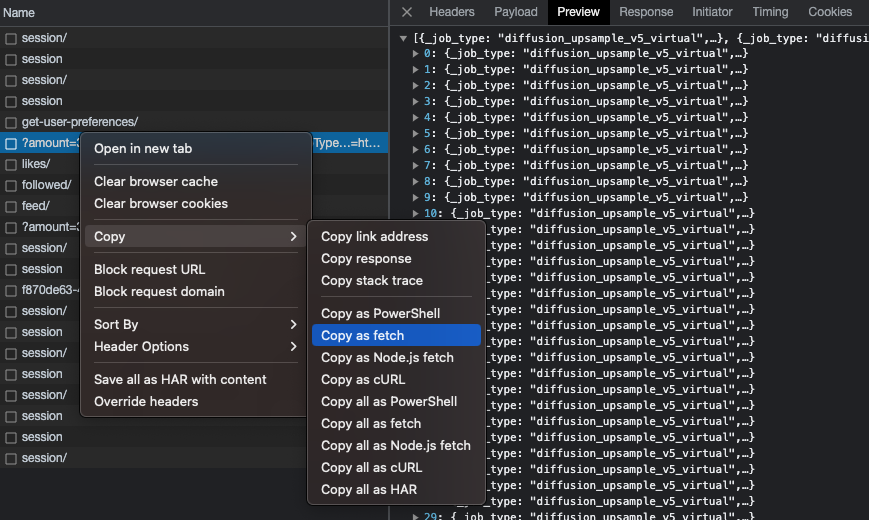
Right-clicking on the request and clicking “copy as fetch” generates the Javascript code necessary to make a request from the console. Then it’s just a matter of running it many times over with different values on the page parameter and pushing the result into a JSON file containing all our metadata. My resulting JSON file contains metadata for 7,188 and is 650k lines since I saved all the metadata.
fetch("https://www.midjourney.com/api/app/recent-jobs/?amount=35&dedupe=true&jobStatus=completed&jobType=upscale&orderBy=hot&refreshApi=0&searchType=null&service=main&user_id_ranked_score=0%2C4%2C5&_ql=todo&_qurl=https%3A%2F%2Fwww.midjourney.com%2Fapp%2Ffeed%2F", {
  "headers": {
    "accept": "*/*",
    "accept-language": "en-US,en;q=0.9",
    "sec-ch-ua": "\"Not)A;Brand\";v=\"24\", \"Chromium\";v=\"116\"",
    "sec-ch-ua-mobile": "?0",
    "sec-ch-ua-platform": "\"macOS\"",
    "sec-fetch-dest": "empty",
    "sec-fetch-mode": "cors",
    "sec-fetch-site": "same-origin"
  },
  "referrer": "https://www.midjourney.com/app/feed/",
  "referrerPolicy": "origin-when-cross-origin",
  "body": null,
  "method": "GET",
  "mode": "cors",
  "credentials": "include"
});
And voila! With a simple script, we can tap into MidJourney’s reservoir of AI-generated images, obtaining the vital metadata that serves as the backbone for Cathedral’s immersive experience. Onward to the next phase!
Data Wrangling and Semantic Similarity: Connecting the Dots in the Cathedral
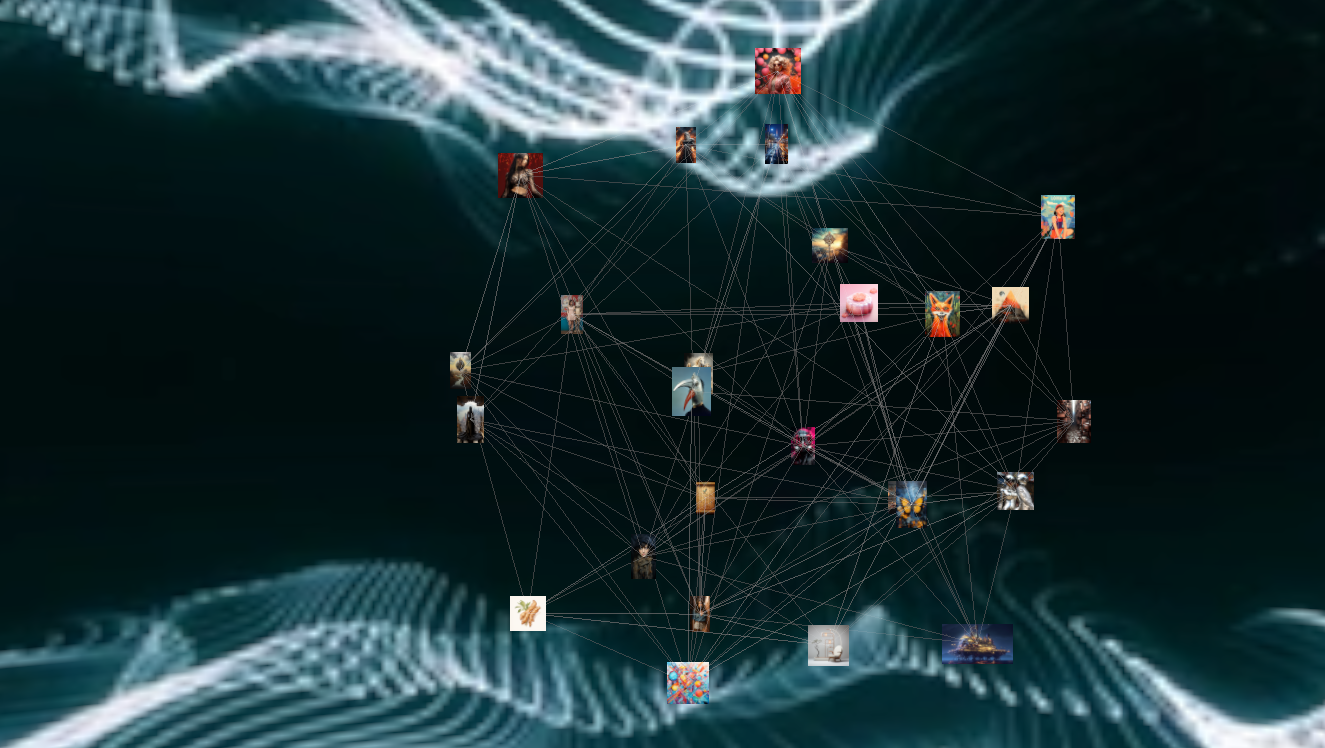
When I conceived the Cathedral of Infinite Creation, I envisioned it as more than just a gallery of AI-generated images. I wanted it to be a dynamic network—a sort of virtual brain composed of nodes (images) and edges (connections between images). Picture this as a digital representation of our collective unconscious, continuously morphing as new content gets added.
With thousands of images and their corresponding prompts in hand, the next monumental task was to determine how these images are interrelated. A brute-force way to do this could involve using image-to-text models to identify entities within each image (e.g., humans, cars, landscapes). If two images contained the same entity, we could draw an edge between them. However, as you can imagine, applying this approach to thousands of images could become not just cumbersome but also require intricate manual logic.
The Elegant Solution: Semantic Embeddings
Enter the concept of text embeddings—a technique that converts each piece of text into a high-dimensional vector. In a way, these vectors capture the "essence" of the text, allowing us to make semantically meaningful comparisons. By comparing the vectors, we can gauge the similarity between two pieces of text, or in our case, the prompts of the images. When the vectors of two image prompts are close in the high-dimensional space, it signifies that they share semantic characteristics, and hence, an edge is drawn between them.
Thanks to advancements in AI, computing these embeddings has become both rapid and economical. OpenAI’s text-embedding models can be accessed with ease, providing a quick and cost-effective way to turn textual prompts into meaningful numbers.
Computing the embeddings was fairly trivial. I wrote a small Python script that iterated through the JSON file and passed each prompt into the OpenAIEmbeddings that Langchain provides. I stored the resulting embedding into the element and voila.
Once we have these embeddings, determining which images should be connected becomes a much simpler and more efficient process. We can use distance measures like cosine similarity to decide which vectors—and by extension, images—are similar enough to deserve an edge between them.
Generating a Network based on Semantic Similarity
With the embeddings calculated, it was straightforward to calculate a semantic similarity score. I used the cosine_similarity method in the sklearn package to calculate a cosine similarity score for every pair of images. The result is a N x N array containing a score between 0 and 1.
embedding_matrix = []

for element in all_images:
    embedding_matrix.append(element["embedding"])

similarities = cosine_similarity(embedding_matrix)

# Results in the array below:
#
# array([[1.        , 0.77911004, 0.81937526, 0.80392125, 0.7655019 ],
#        [0.77911004, 1.        , 0.79608392, 0.81086091, 0.75359267],
#        [0.81937526, 0.79608392, 1.        , 0.79420443, 0.79456192],
#        [0.80392125, 0.81086091, 0.79420443, 1.        , 0.7746613 ],
#        [0.7655019 , 0.75359267, 0.79456192, 0.7746613 , 1.        ]])
Now was the more interesting part: taking this matrix and representing it as a connected graph. The target data format for our graph is below. It contains nodes (a list of nodes containing an ID, the URL of the image, and the prompt) and links (a list of edges between pairs of images).
{
	"nodes" : [
		{
			"id": "fff56b19-e02f-4962-aeb7-753617f99204",
      "img_url": "https://cdn.midjourney.com/3d978b02-d0b9-4f3a-a464-1bdd170a1791/0_2.png",
      "prompt": "Create a kilt pattern-inspired design with visible knit material with neutral tones"
		},
		{
			"id": "21302954-dbd0-4fe3-8f74-4b663f76dbd1",
      "img_url": "https://cdn.midjourney.com/d1c69aa8-21ed-489f-96a9-62d369d5d21e/0_2.png",
      "prompt": "black background vibrant colors, symbols, pattern, pop art, various fun shapes"
    }
	],
	"links" :
		[
				{
            "source": "21302954-dbd0-4fe3-8f74-4b663f76dbd1",
            "target": "1d65973c-b5b0-428d-9ff5-894507961d55",
            "strength": 0.8094726039236871
        },
        {
            "source": "21302954-dbd0-4fe3-8f74-4b663f76dbd1",
            "target": "fff56b19-e02f-4962-aeb7-753617f99204",
            "strength": 0.8284720027803651
        },
		]
}
As you might be able to see in the small samples above, the cosine similarity scores are often quite high. My decision was to create an edge if the cosine similarity was above 0.8. I also felt that the data schema was quite inefficient: representing edges as pairs exclusively meant that there was a lot of duplication… So I opted to create a cleaner intermediate representation of links that would allow me to get all the edges for a given node without parsing the entire list. This was important because I wanted to build an experience that would have the graph evolve over time instead of visualizing thousands of images in one go.
{
	"nodes" : [
		{...}
	],
	"links" :
		{
			"source": "21302954-dbd0-4fe3-8f74-4b663f76dbd1"
			"targets":
				[
					["1d65973c-b5b0-428d-9ff5-894507961d55",0.8094726039236871],
					["fff56b19-e02f-4962-aeb7-753617f99204",0.8284720027803651]
		}
}
Here’s the resulting logic to generate the final input data. Note that since the matrix is symmetrical and the resulting graph is not directed, I only have to process one side of the main diagonal 🤓.
input_json = {
    "nodes" : [],
    "links" : {}
}

for n, element in enumerate(with_embeddings):
    print(f"Processing element: #{n}")
    input_json["nodes"].append({
        "id" : element["id"],
        "img_url" : element["image_paths"][0],
        "prompt" : element["prompt"]
    })
    input_json["links"][element["id"]] = []
    similarity_m = similarities[n]
    for i, s in enumerate(similarity_m[n+1:]):
        if s > 0.8 and element["id"] != with_embeddings[i]["id"]:
            input_json["links"][element["id"]].append([with_embeddings[i]["id"], s])

json_object = json.dumps(input_json, indent=4)

with open("input_graph.json", "w") as outfile:
    outfile.write(json_object)
We now have an input file ready that contains all our images, their prompts, URLs, and associations between them.
Putting it all together: building an interactive 3D visualizer
Finally! In this section I will take you through how I built this app. This Javascript application uses THREE.js to create and render a 3D environment in your browser and the 3d-force-graph library for network graph visualization. In addition, we have some simple logic to play some music and audio effects to create a more immersive experience. Let’s begin.
THREE.js: A Foundation for 3D Visualization
If you're unfamiliar with the world of 3D web graphics, then it's high time you meet THREE.js—a powerful JavaScript library designed to create and render 3D graphics right in your web browser. The library abstracts many of the complex methods involved in WebGL, the JavaScript API for rendering high-performance interactive 2D and 3D graphics within any compatible web browser, making it more accessible and easier to work with.
Why Use THREE.js?
- Ease of Use: Working directly with WebGL can be an involved and tedious process that requires a deep understanding of shaders, matrices, and other complex mathematical concepts. THREE.js simplifies this process, offering pre-defined objects, materials, and lights that can be easily manipulated to create a compelling 3D scene.
- Rich Features: From simple geometries like cubes and spheres to complex models loaded from JSON or STL files, THREE.js has an extensive range of features that can breathe life into your visualizations. It supports camera controls, animation, shadows, and even post-processing effects out of the box.
- Community and Documentation: Being one of the most popular 3D libraries for the web means that there is a plethora of tutorials, example projects, and an active community ready to help solve any problem you may encounter.
- High Performance: Despite its ease of use, THREE.js is optimized for performance. You can create complex scenes with thousands of objects, lights, and materials without having to worry too much about framerate drops and performance hiccups.
For this project THREE.js served as the foundational layer. Its feature-rich toolset and ease of use allowed me to focus more on the creative and functional aspects of my project, rather than getting bogged down in the technicalities of 3D graphics rendering. Stay tuned as we delve deeper into the building blocks of this fascinating project.
Creating our environment
One of the easiest ways to create an immersive world in our 3D environment is to take an equirectangular image and wrap it around a sphere. When you place the user in a sphere, they have a 360 degree environment that feels surprisingly convincing.
My first step was to find a cool and trippy equirectangular video that I could use. I picked a nice asset from the Adobe store then created a VideoTexture which I applied to a material on a giant sphere. Now I had a pretty nice background for my scene with cool undulating waves that conveyed something serene but bigger than the individual.
function getSkyVideo() {
    const geometry = new THREE.SphereGeometry( 5, 60, 40 );
    geometry.scale( - 500, 500, 500 );
    const video = document.getElementById( 'video' );
    video.play();
    const texture = new THREE.VideoTexture( video );
    texture.colorSpace = THREE.SRGBColorSpace;
    const material = new THREE.MeshBasicMaterial( { map: texture } );

    const mesh = new THREE.Mesh( geometry, material );
    return mesh
}
Music and Sound Effects
For maximum immersion, I felt it was important to get some music and sound effects. I went on www.freesound.org to find some creative commons sound effects (a "whoosh" sound for when the user clicks on an image and a "drop" sound for when a new image is added). I also found a CC-licensed 1 hour track to create a dark and mysterious atmosphere.
Creating our 3D network
The pièce de résistance! Fortunately, an engineer and “data sculptor” (love it) by the name of Vasco Asturiano created an amazing library called 3d-force-graph which helps us do exactly what we need. 3D Force-Directed Graph is a web component to represent a graph data structure in a 3-dimensional space using a force-directed iterative layout. It uses ThreeJS/WebGL for 3D rendering and either d3-force-3d or ngraph for the underlying physics engine.
This was amazing because rather than dealing with the intricacies of THREEE.js (camera, rendering, controls, scene, etc.) I could just use this component to easily generate a graph and modify the scene as I saw fit. For instance, this example of a random graph was generated in 14 lines of code:
// Random tree
  const N = 300;
  const gData = {
    nodes: [...Array(N).keys()].map(i => ({ id: i })),
    links: [...Array(N).keys()]
      .filter(id => id)
      .map(id => ({
        source: id,
        target: Math.round(Math.random() * (id-1))
      }))
  };

  const Graph = ForceGraph3D()
    (document.getElementById('3d-graph'))
      .graphData(gData);
Step 1: Retrieving the data and making it fit the right format
First off, we need to get the data from our JSON and prepare for the input format (described above). To highlight the fact that users are continually generating new images, I first randomize the list of nodes. Then, I for each of the nodes in our randomized list, we look up the links and construct an object that conforms to the graph data format. This ensures that the graph is initialized with a random set of nodes that may (or may not) be connected.
const jsonUrl = 'network_new_format_100.json'
fetch(jsonUrl).then(r => r.json()).then(json => {
    overlay.remove();
    document.getElementById('backgroundvideo').remove();
    let { nodes, links } = json

    const nodes_shuffled = nodes.sort( () => Math.random() - 0.5);

    let sliced_nodes = nodes_shuffled.slice(0, init_node_amount)

    let init_graph_data = {
        "nodes": sliced_nodes,
        "links": []
    }

    let sliced_nodes_list = sliced_nodes.map(node => node["id"])

    sliced_nodes.forEach(element => {
        let l = links[element["id"]]
        l.forEach(link => {
            if (sliced_nodes_list.includes(link[0])) {
                init_graph_data.links.push(
                    {
                        "source" : element["id"],
                        "target" : link[0],
                        "strength" : link[1]
                    }
                )
            }
        });
    });

...
Step 2: Constructing our Graph
Now we can instantiate our graph with data! We do so with ForceGraph3D and add a bunch of parameters that change the graph’s look and behavior. After passing in our init_graph_data object we created above, the most important bit is nodeThreeObject which allows us to generate a custom 3D object to render as graph nodes. In our case, we want to replace each node (typically a boring sphere) with a sprite of each image.
In computer graphics, a sprite refers to a two-dimensional image or animation that is integrated into a larger scene. Unlike complex 3D objects that require a considerable amount of computational power to render, sprites are a lightweight alternative that can be manipulated in a 3D environment. In the context of THREE.js, sprites are essentially "flat" objects that always face the camera. They are particularly useful when you want to represent objects in a 3D scene without the computational burden of rendering them in full 3D, such as background elements, particles, or icons.
I use a series of then() chains to make sure the image is loaded into a texture before the texture is applied to a sprite. Since sprites are rendered in a 1x1 format by default, we have to do some minor scaling transformations and then we’re done.
const Graph = new ForceGraph3D()
        (document.getElementById('3d-graph'))
            .graphData(init_graph_data)
            .linkOpacity([0.05])
            .linkDirectionalParticles("strength")
            .linkDirectionalParticleSpeed(d => d.strength * 0.001)
            .linkDirectionalParticleWidth(0.2)
            .cameraPosition({ z: 200 })
            .showNavInfo(true)
            .d3VelocityDecay(0.85)
            .nodeThreeObject(node => {
                const sprite = new THREE.Sprite();
                function loadTexture(url) {
                    return new Promise(resolve => {
                      new THREE.TextureLoader().load(url, resolve)
                    })
                }
                loadTexture(node.img_url).then(texture => {
                    texture.colorSpace = THREE.SRGBColorSpace;
                    const material = new THREE.SpriteMaterial({ map: texture });
                    sprite.material = material;
                    let img_height = texture.source.data.height;
                    let img_width = texture.source.data.width;

                    const y_scale = 10
                    const x_scale = y_scale * img_width / img_height;

                    sprite.scale.set(x_scale, y_scale, 1)
                })

                return sprite;
            })
At this point I had a fully rendered network with a subset of random nodes and edges. But to make this more engaging we need to make it interactive…
Step 3: Making it Interactive
Thankfully, our component has a useful onNodeClick() method which allows us to do something to a node if it’s clicked on. Since this is an interactive exploration of AI-generated images, I wanted to “fly” to a node that’s clicked on. The code below allows us to achieve that: first we calculate the new position of the camera, then we set it with Graph.cameraPosition(), show the prompt on the bottom, and finally fix the node in place (we do this because as new nodes are added the physics engine makes them wiggle a bit, which is undesirable). If the node clicked on is different from the one currently being viewed, we play a “whoosh” sound and unfix the previous node.
.onNodeClick(node => {
  click_history.push(node)
  let previous_node_clicked = click_history[click_history.length - 2]

  if (node.id != previous_node_clicked && previous_node_clicked != undefined) {
      playEffect('click')
      promptOverlay.classList.toggle("show");
      // Unfix previous node position
      delete previous_node_clicked.fx;
      delete previous_node_clicked.fy;
      delete previous_node_clicked.fz;
  }

  const distance = 20;
  const distRatio = 1 + distance/Math.hypot(node.x, node.y, node.z);

  const newPos = node.x || node.y || node.z
    ? { x: node.x * distRatio, y: node.y * distRatio, z: node.z * distRatio }
    : { x: 0, y: 0, z: distance }; // special case if node is in (0,0,0)

  Graph.cameraPosition(
    newPos, // new position
    node, // lookAt ({ x, y, z })
    3000  // ms transition duration
  );

  promptOverlay.innerHTML = node.prompt;
  // Add fade-in class to overlay
  promptOverlay.classList.toggle("show");

  // Fix node position
  node.fx = node.x;
  node.fy = node.y;
  node.fz = node.z;
});
Lastly, we want to add new nodes every so often. To achieve this, I use a setInterval() function that allows me to, every 5 to 10 seconds, select a random node that’s not already in the graph, figure out which other nodes it’s linked to, then add it to graph. To make these events more exciting, I play a sound effect every time this happens and also make the screen flash slightly using an animated UnrealBloomPass(). The end result is really nice.
The Final Touches (UI and Deployment)
We need to have an explicit user interaction before the experience begins. On one hand, I wanted to give users an introduction to the experience and the opportunity to read a little bit about it. On the other hand, modern browsers prevent audio and video from being autoplayed unless a user clicks on something before (to prevent spam). Using very simple HTML and CSS (jk, I spent hours fixing CSS issues…), I created a home page (with an about section) with an “about” button that reveals some more information about the project, and an “explore” button that begins the experience (in the background it calls the function init()).
Finally, I built the package (npx vite build) and deployed it using it Vercel. I bought a cheap domain on Porkbun (Google Domains RIP 💀) and connected everything.
The final thing is available at www.infinitecreation.art
Conclusion: The Journey of Visualizing the Unconscious Through AI-Generated Art
In embarking on this project, my aim was not just to curate a collection of AI-generated images but to visualize them in a way that mirrors the complexity of our collective unconscious. The result is a vibrant, interactive 3D environment that encapsulates the semantic and visual connections between disparate images, offering an exploratory lens into how AI can aid in creative storytelling.
The initial phase involved pulling data from MidJourney, which allowed me to curate a repository of art prompts and their generated images. While initially daunting, this section educated me on the nuances of API requests and data manipulation. I learned how to be discerning in what data I collected and how I stored it, lessons that proved to be foundational for the next steps.
Then came the task of drawing associations between images. After contemplating complicated methods like image-to-text analysis, I opted for an elegant solution—using embeddings to measure semantic similarity. Utilizing OpenAI's embedding models, I efficiently processed the text prompts for each image and computed their embeddings. This not only simplified the process but also introduced me to the power and flexibility of modern machine learning tools.
The most challenging but also the most rewarding part of the project was constructing the 3D visualization. The THREE.js library served as a great introduction to 3D programming in JavaScript, and it was a particularly powerful tool for rendering both simple sprites and complex 3D objects. I was not only able to display each image as a node in a sprawling network but also to make the experience interactive through features like zooming, clicking, and a dynamic addition of new nodes.
In the end, this project became more than just a visualizer. It evolved into an educational journey through data wrangling, machine learning, and 3D graphics programming. The challenges encountered along the way served as vital learning experiences, deepening my understanding of these diverse domains. This project illuminated the interdisciplinary nature of modern technology and how it can be harnessed to turn abstract ideas into tangible, engaging realities.
Whether you're an artist, a programmer, or someone who simply appreciates the intertwining of technology and art, I hope this visualizer provides you with a thought-provoking exploration into the realms of creativity and machine learning.
See More Posts

Work with me.
Interested in collaborating? Reach out!
Copyright © 2023 João Fiadeiro. All rights reserved.